Sales Summary
Sales Overview is the four cards at the top of Finance → Sales Analytics.
The range on the captured screen is Jul 01, 2026 – Aug 24, 2026. Reset sits next to the date picker.
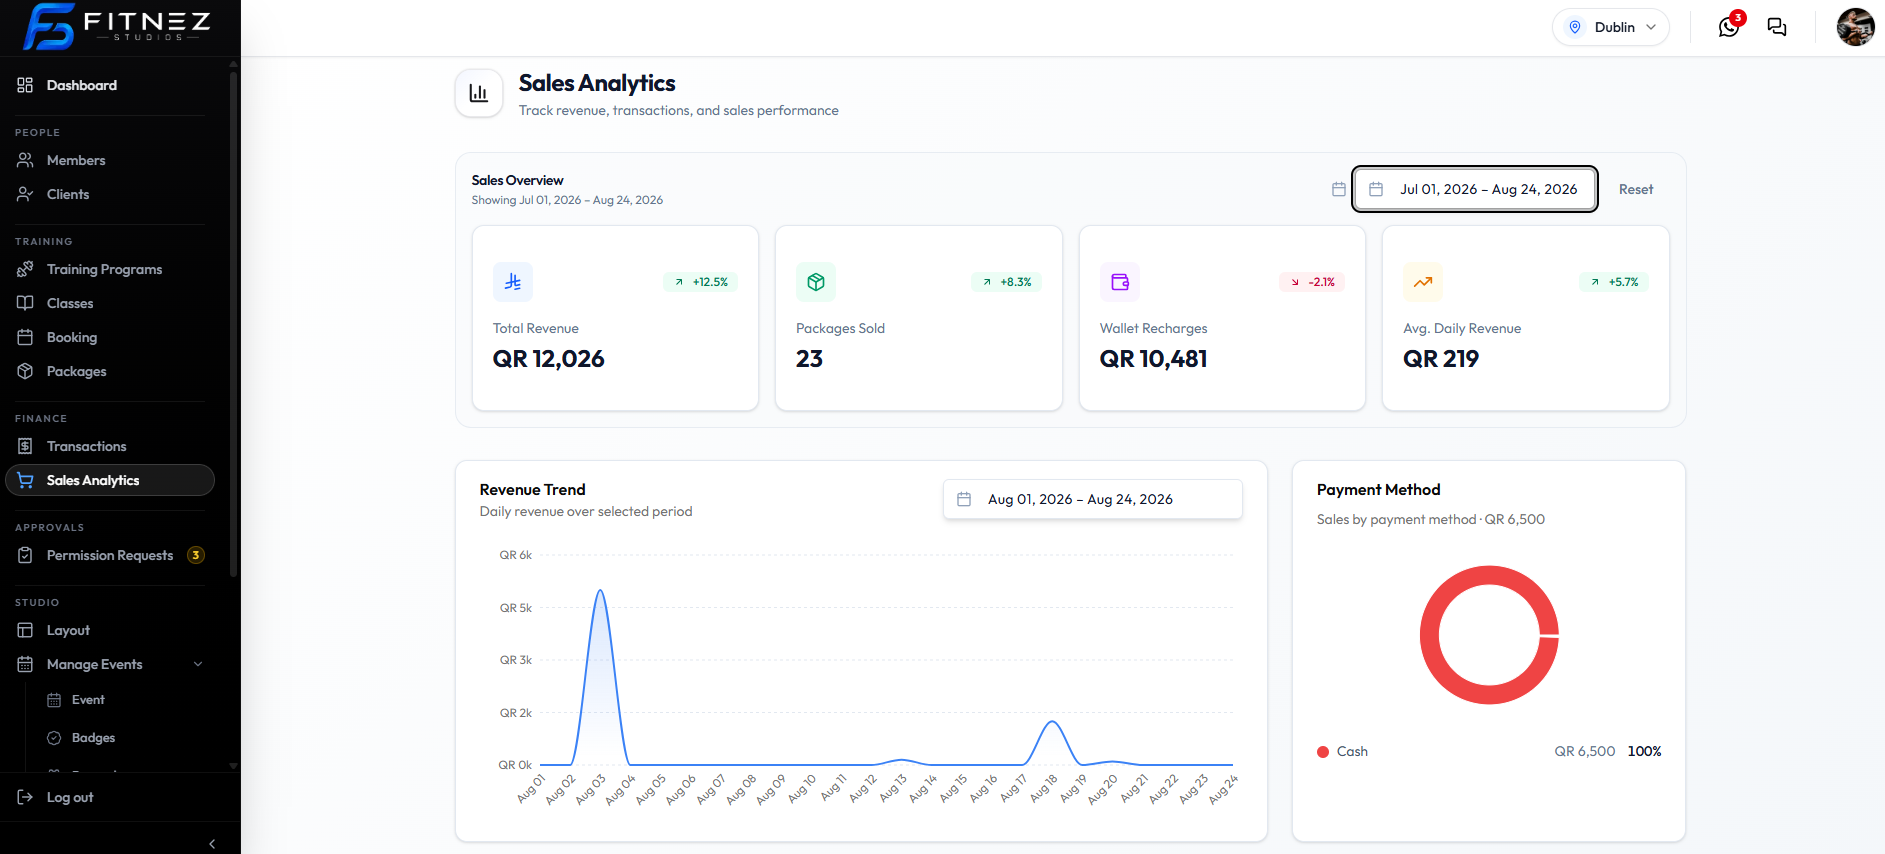
Metrics on screen
| Metric | Value on this screenshot | Change shown |
|---|---|---|
| Total Revenue | QR 12,026 | +12.5% (green) |
| Packages Sold | 23 | +8.3% (green) |
| Wallet Recharges | QR 10,481 | -2.1% (red) |
| Avg. Daily Revenue | QR 219 | +5.7% (green) |
Packages Sold is a count. The other three are money in QR.
Total Revenue is package sales and wallet recharges together. Wallet Recharges and Packages Sold are the split: money topped up, versus how many packages were sold.
Whether refunds or failed payments change these cards is not on the screenshot.
What each card is for (plain language)
| Metric | How to read it |
|---|---|
| Total Revenue | Package sales and wallet recharges together, in QR |
| Packages Sold | How many packages were sold in that range |
| Wallet Recharges | Wallet top-up money in QR — separate from package count |
| Avg. Daily Revenue | Average daily revenue figure for the range |
The % on each card is a comparison with a previous period. The cards do not name that previous period. See Compare This Month With Last Month for the Revenue Summary card, which does name Previous and Difference.
Workflow — View business revenue
- Open Finance → Sales Analytics.
- Set the Overview date range (or Reset).
- Read Total Revenue and Avg. Daily Revenue.
- Use Revenue Trend for day-by-day shape.
Related Articles
Last updated on