Revenue This Month
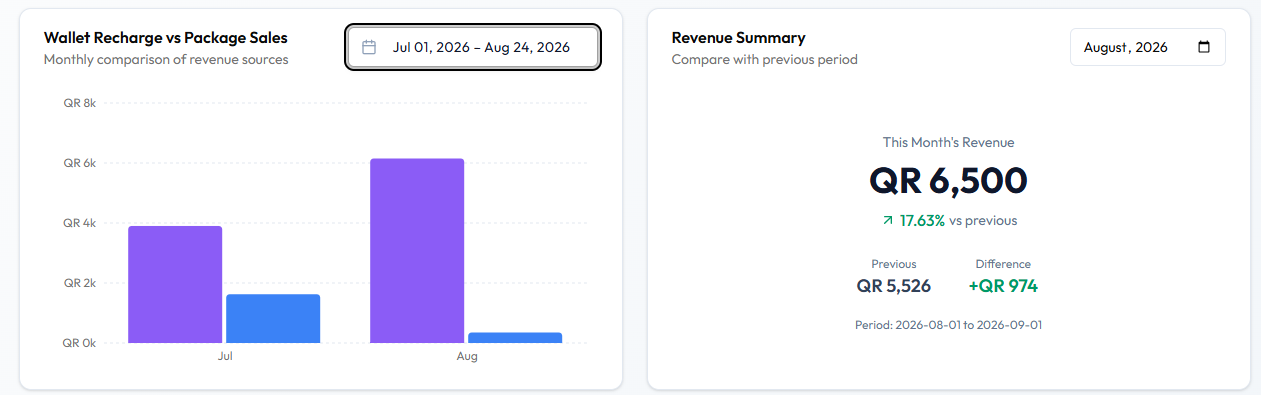
Revenue Summary sits under Sales Analytics. The subtitle is Compare with previous period.
The month control on this screenshot is August, 2026.
What is shown
| Label | Value on this screenshot |
|---|---|
| This Month’s Revenue | QR 6,500 |
| Comparison | 17.63% vs previous (green, up) |
| Previous | QR 5,526 |
| Difference | +QR 974 (green) |
| Footer | Period: 2026-08-01 to 2026-09-01 |
This Month’s Revenue is the month selected on that card (August, 2026). It is not the same figure as Overview Total Revenue (QR 12,026 for Jul 01, 2026 – Aug 24, 2026).
The footer period runs 2026-08-01 to 2026-09-01. The screen does not say whether 2026-09-01 is included. Read it as the period printed on the card.
Whether this is calendar August, month-to-date, or another window besides the footer dates is not explained on the card. Refunds and failed payments are not mentioned.
Payment Method on the same page shows QR 6,500 all Cash — the same amount as This Month’s Revenue on this capture. Do not assume those two widgets always match.